Emotion AI Chart Design & UX
-
My buddies at Longblink needed some help with a project for their client, Cognovi Labs – an Artificial Intelligence company that uses revolutionary psychology-driven AI to create predictive tools that engage, anticipate and shape the future. The Cognovi Emotion AI™ technology combines "big data," machine learning, and pattern recognition to extract large populations' significant emotional attitudes and affective patterns. Emotion AI enhances emotional engagement between people, organizations, and machines, uniquely positioning them to provide the emotional layer of Web3 and the metaverse.
-
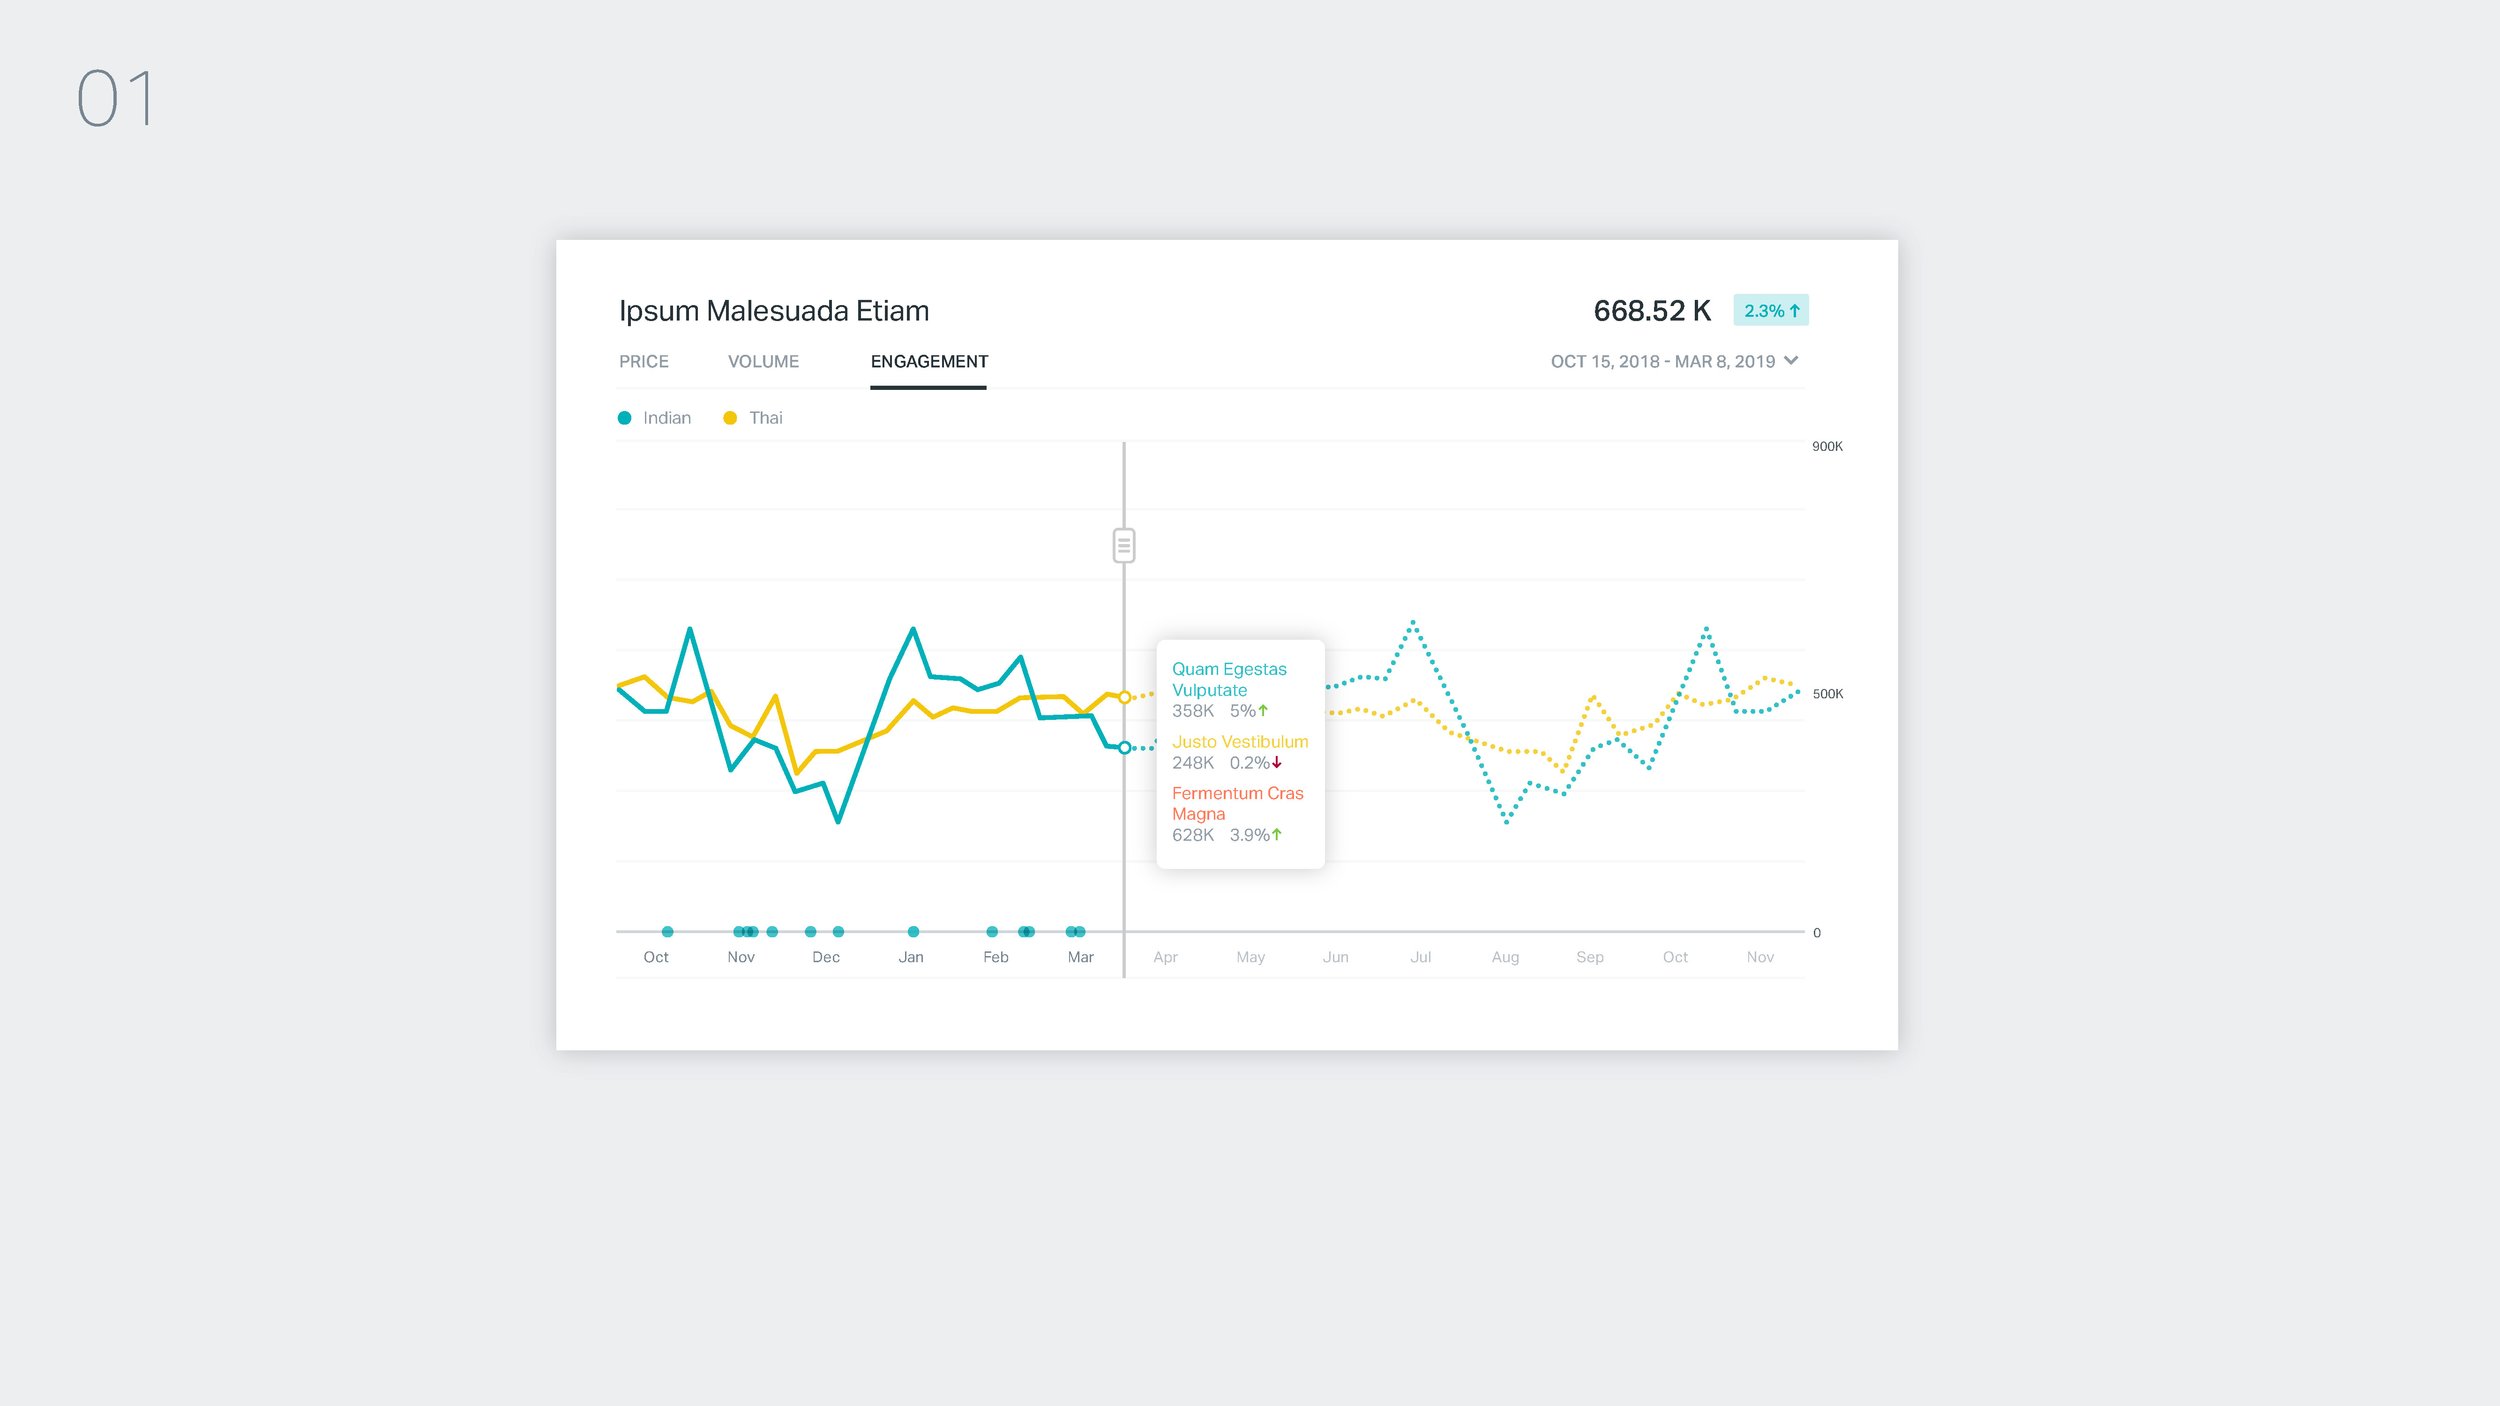
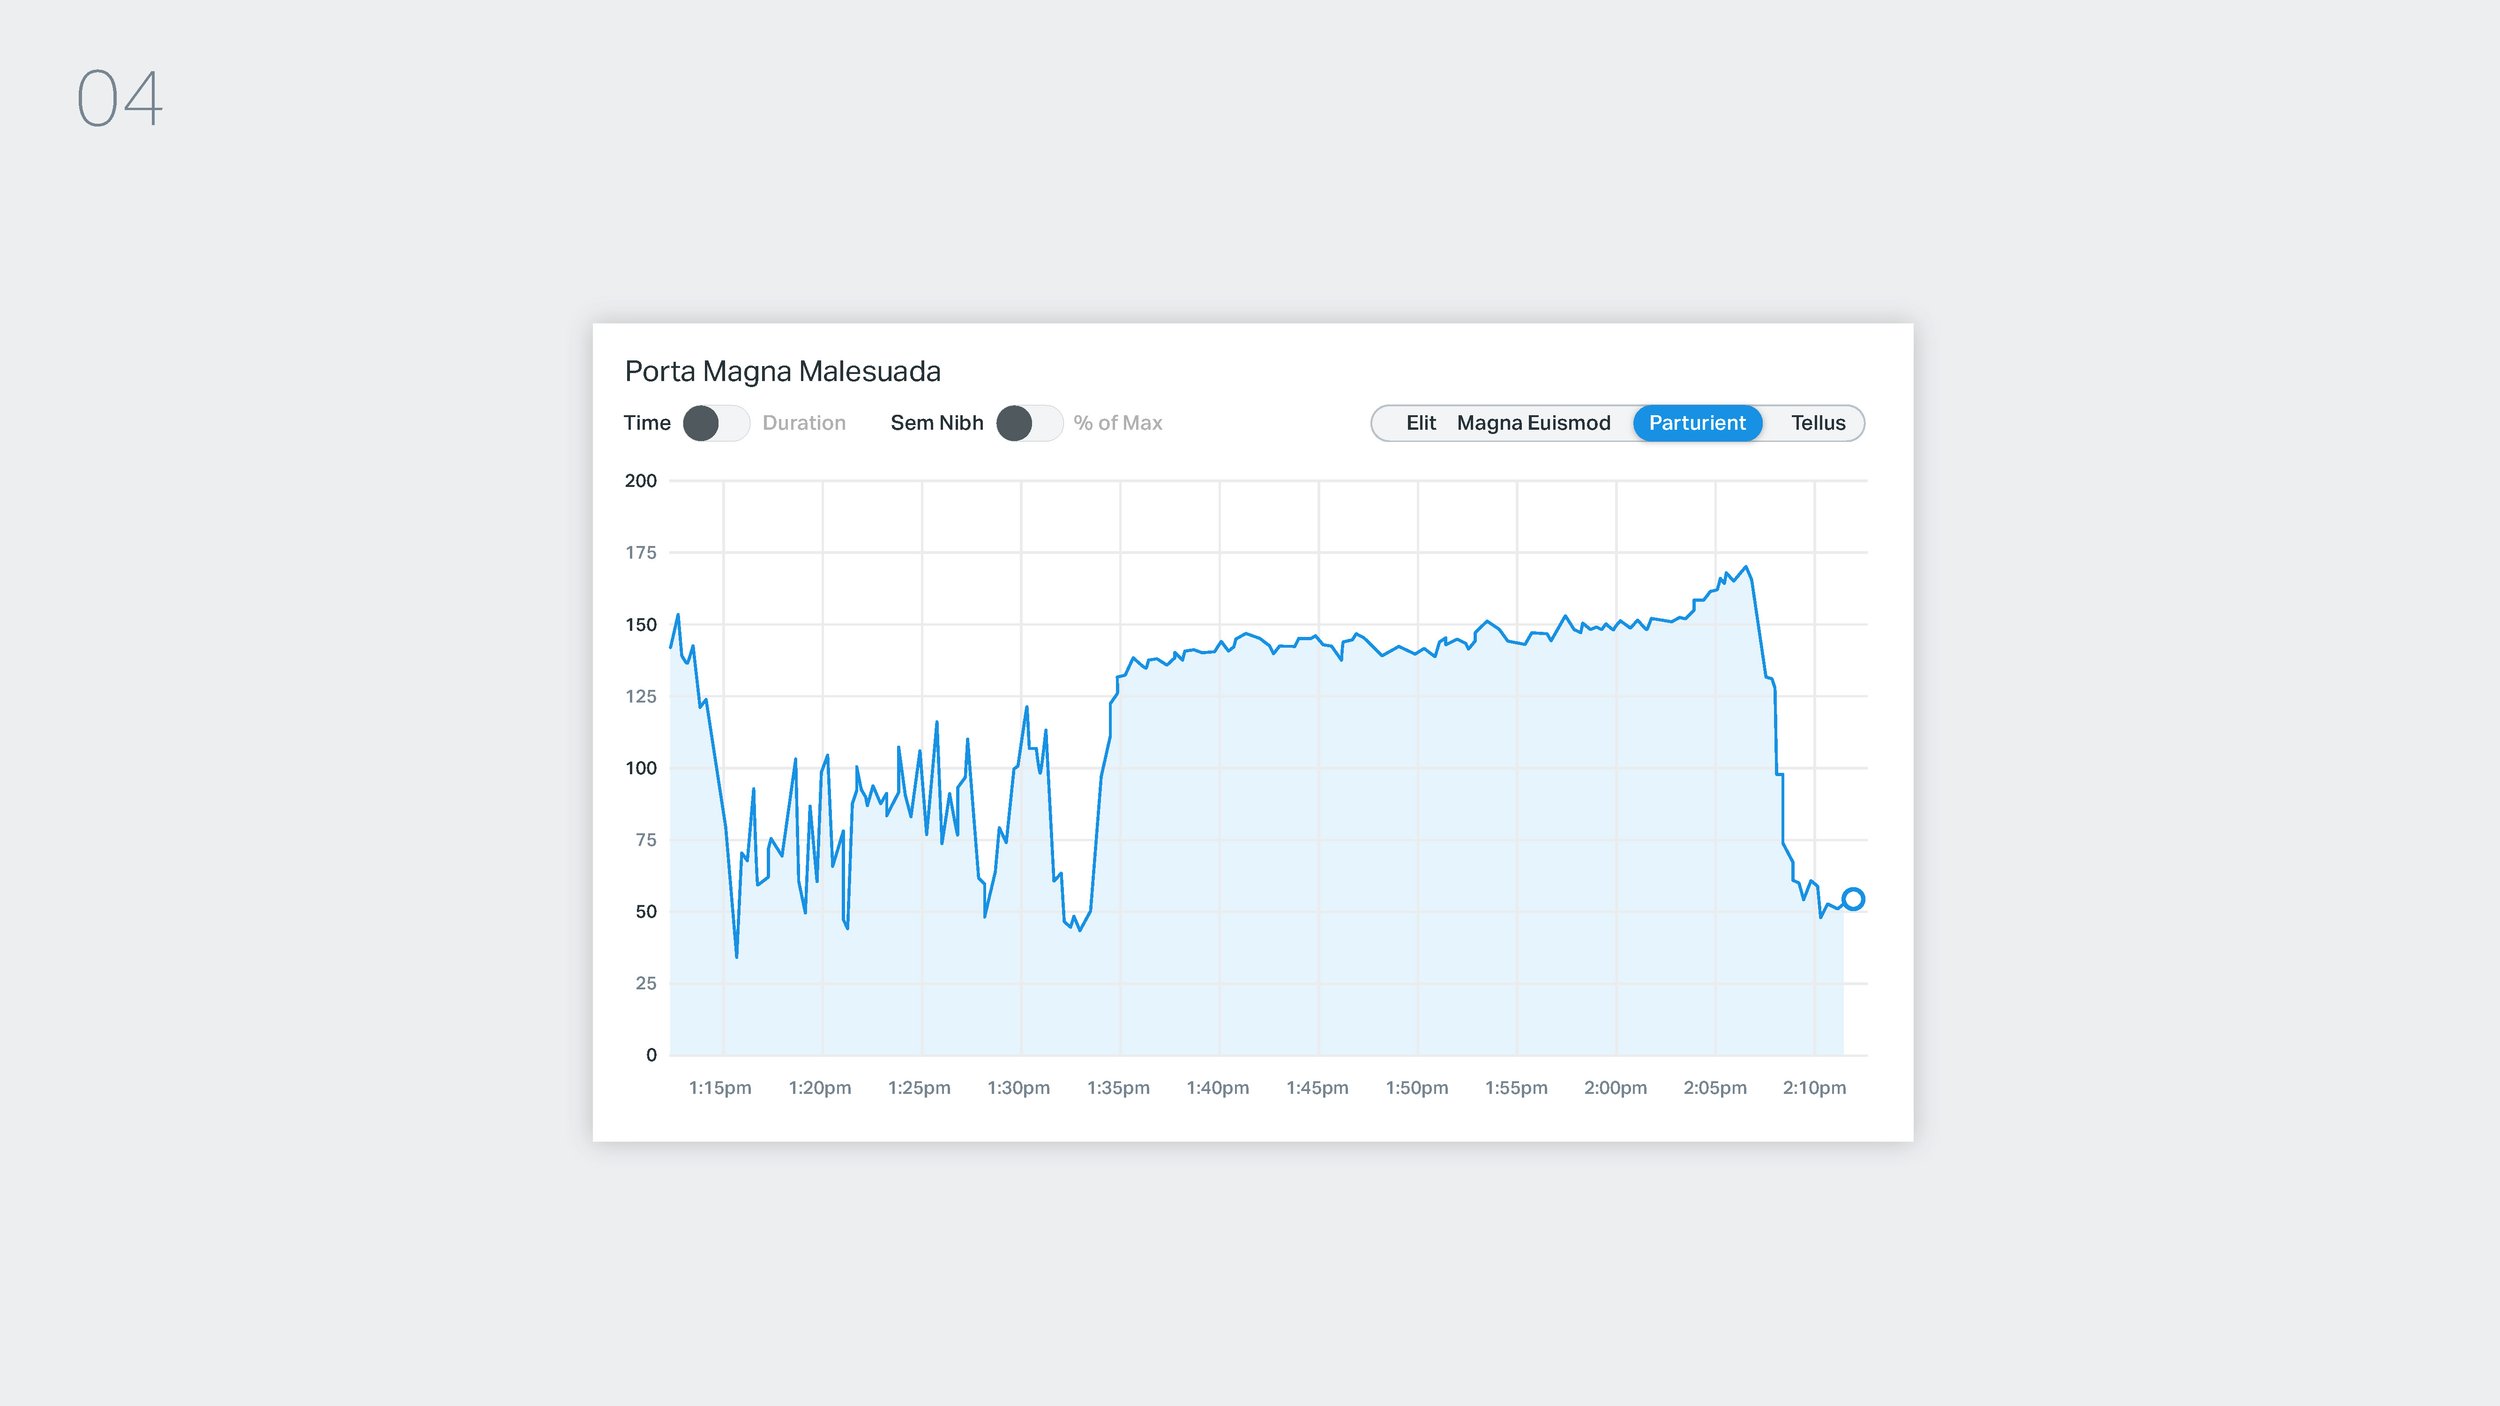
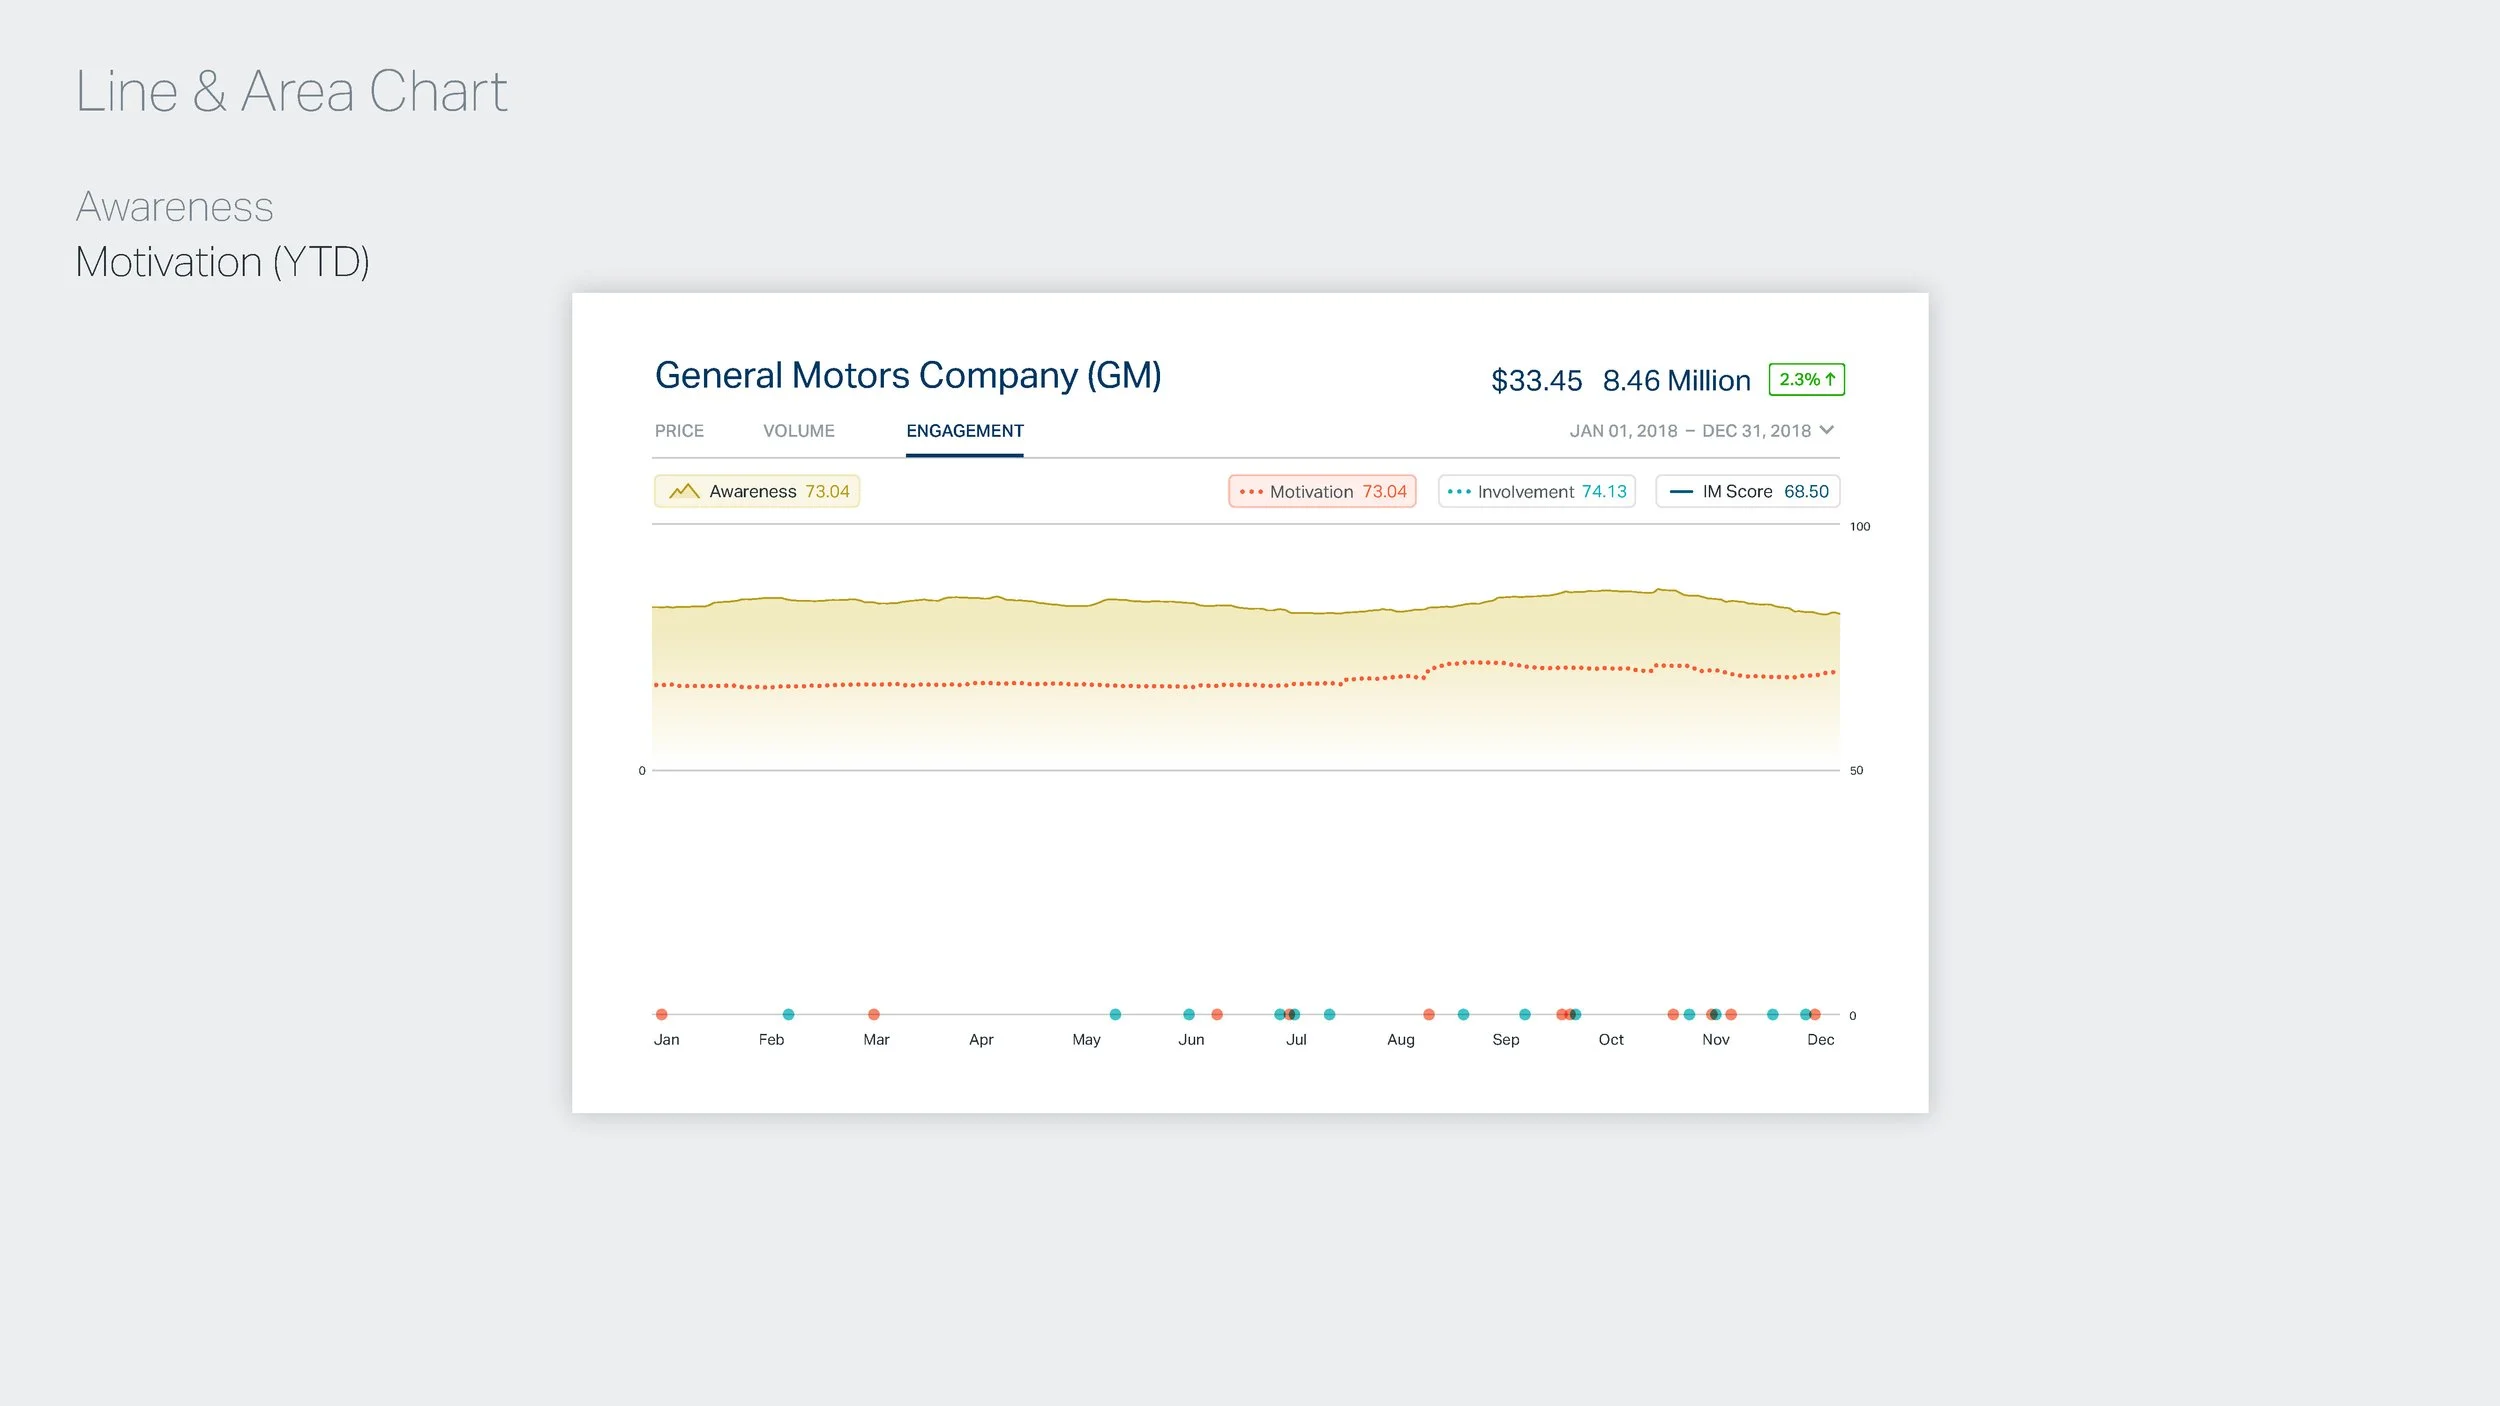
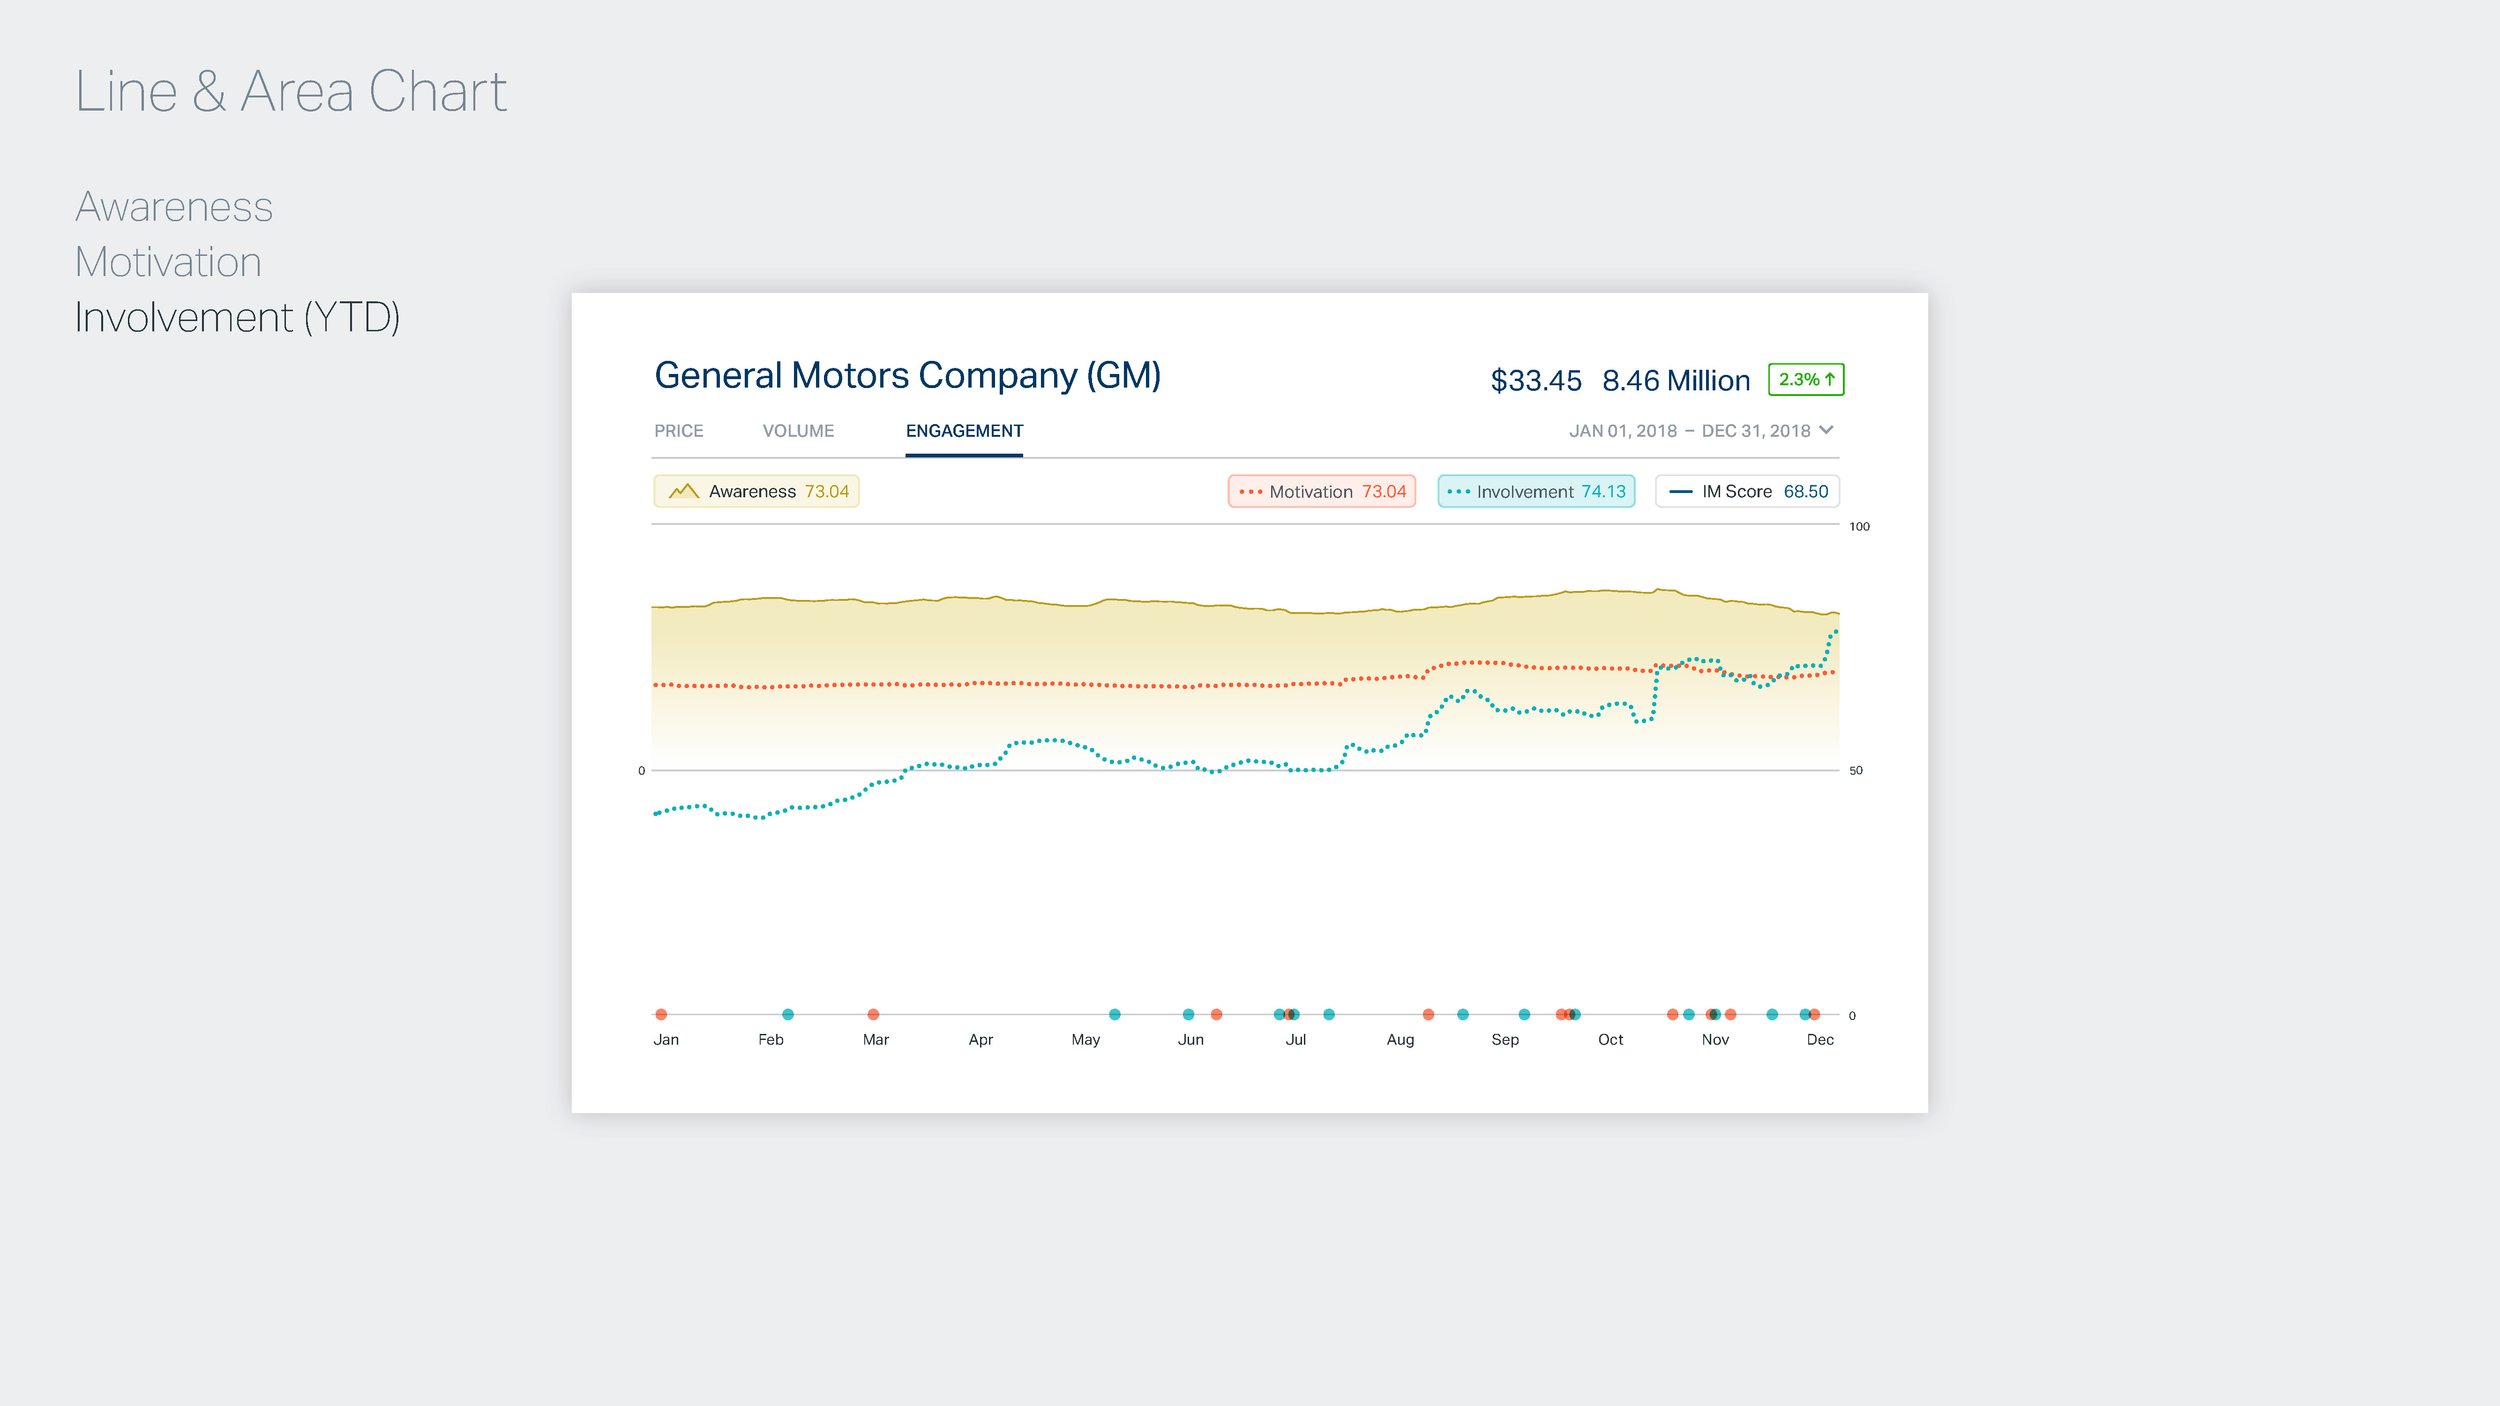
New kinds of data need new types of data visualizations. The technology is founded on academic research and innovative methods that data-mine free-flowing conversations in short-form social media texts (like Twitter posts). This large data pool constantly identifies the most relevant emotional undercurrents about targeted issues. The data needed visualization so traders and researchers could gauge this new expression of emotional sentiment through a simple, familiar interface.
-
In addition to the visualization design we needed to design the UX and UI interface that would allow the programmers to display the Data into trading terminals (specifically the Bloomberg Terminal) and other online platforms.
The future, now.
After successfully designing and implementing the Emotional AI data into the Bloomberg Terminal, it’s been exciting to see where else their Cognovi technology has been used. It turns out the technology is not only great for predicting and modeling emotional intent but it’s been an enormous resource for efforts like the US armed forces in the Middle East. On the ground, the data sets help analyze and predict procurement needs and use pattern recognition to understand where the needed equipment is to where the soldiers are.


